Building a fully integrated water modelling ecosystem
A fully integrated water modelling ecosystem brings hydraulic models, GIS, asset records, monitoring data, spreadsheets and scripts into one repeatable, auditable workflow. In most water companies today, this works from extracts of each system rather than live connections to source data. An integration layer coordinates that workflow, applying model updates, running simulations and recording every step. This gives water companies a consistent evidence base for DWMP, CSO spill reduction and AMP-8 investment decisions, without replacing the tools their teams already use.
How is an integrated modelling ecosystem different from a data lake?
Many water companies already hold monitoring data in a data lake or shared database. That improves access to data, but not consistency of method. If each team still extracts data and processes it with its own spreadsheets, scripts and assumptions, two studies drawing on the same source can reach different results.
An integrated workflow addresses the process. Each system keeps doing its own job: the hydraulic model simulates network performance, GIS manages spatial information and asset systems hold asset records. Extracts from each are applied to models in a defined order, using agreed rules, with every step recorded. Some water companies are now looking to link monitoring data held in a data lake to their simulation data, and an integrated workflow provides the structure to do this consistently.
Which systems make up a water modelling ecosystem?
Most wastewater modelling ecosystems combine five types of system.
| Component | What it contributes | Examples |
| Hydraulic network models | Predicted flows, levels, flooding and spills | InfoWorks ICM 1D sewer models |
| GIS | Asset locations, spatial relationships and mapped risk | QGIS |
| Asset information | Asset characteristics, completed and planned schemes | Asset records and management systems |
| Monitoring data | Observed performance for calibration and verification | EDM and flow survey data |
| Processing logic | Growth, creep and intervention rules, costs and reporting | Excel, Python and Ruby scripts |
Why does integration matter under AMP-8?
Integration matters because AMP-8 has increased both the modelling evidence water companies must produce and the data they must interpret.
Ofwat’s final determinations approved £104bn of investment for 2025-30. Every storm overflow in England is now fitted with an Event Duration Monitor, and the Environment Agency recorded 291,492 spill events in 2025. That record is valuable calibration evidence, if it reaches models consistently.
The guiding principles for DWMPs expect plans to use robust evidence, including modelling and EDM, to present risk visually through mapping and to cover a minimum 25-year horizon. Ofwat also describes data and the processes and technology behind it as assets comparable to pipes and treatment works. Meeting these expectations across hundreds of models is difficult when every hand-off is manual.
How does an integration layer work?
An integration layer orchestrates existing tools within a single automated workflow and records how every output was produced.
Instead of modellers copying data between platforms by hand, the workflow takes extracts from each source and applies them in a defined sequence:
- Apply agreed growth, creep and intervention rules using GIS and asset data extracts.
- Update the InfoWorks ICM model and submit the required simulations.
- Extract performance metrics, such as spill frequency, flooding and cost.
- Pass results to calibration, sensitivity analysis or optimisation, logging each step.
Defined once, the sequence can be applied consistently across hundreds of catchment models, with simulations running in parallel. Optimisation can then search intervention combinations and present cost-performance trade-offs as ranked options and heatmaps.
How does integration support calibration and digital twins?
An integrated workflow makes calibration repeatable, because monitoring data, model parameters and verification targets are handled within one controlled process.
Modern CSO assessment requires models to reproduce seasonal variation and annual spill frequencies over multiple years. Bringing extracted EDM records and flow survey data into the same workflow as the model lets calibration test parameter combinations across many monitors and periods at once, within engineer-set limits. When a new extract of monitoring data becomes available, the same calibration can be re-run consistently.
This is also the groundwork for digital twins. For most water companies, connecting models directly to live EDM data, so they are recalibrated continuously and drift from observed performance is detected as it happens, is a future step. A repeatable, extract-based calibration process is what makes that step achievable.
Building an integrated modelling ecosystem with HEEDS
HEEDS for Water combines Siemens Simcenter HEEDS with STRIDE’s Water API to provide this integration layer. The Water API connects HEEDS to InfoWorks ICM, while workflows execute Python, Ruby and Excel logic and draw on GIS data. Siemens states that HEEDS interfaces with commercial CAD and CAE tools and distributes runs across Windows, Linux, cluster and cloud resources.
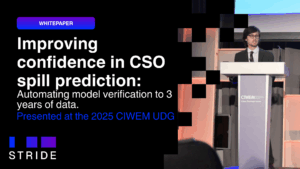
In work presented at CIWEM UDG 2025, STRIDE used HEEDS to automate CSO model verification against multi-year EDM and groundwater data, achieving spill predictions within ±20% across 10 sites. Engineers retain control of assumptions, parameter limits and sign-off.
Learn how to implement SuDS systems and reduce CSO spills in every catchment. Download A Water Modeller’s Guide to Reducing CSO Spills now.